关于Prometheus监控部署之后我会补上一篇完整的Prometheus联邦集群的监控系统,现在先讲在Kubernetes下的(重点就是在K8S下,POD的IP随着应用迭代发布IP都在变化,不能按照网络上的一些配置静态的监听地址端口就行,需要自定义写prometheus的服务发现规则)springboot这块应用监控是如何收集监控数据
<?xml version="1.0" encoding="UTF-8"?>
<project xmlns="http://maven.apache.org/POM/4.0.0" xmlns:xsi="http://www.w3.org/2001/XMLSchema-instance"
    xsi:schemaLocation="http://maven.apache.org/POM/4.0.0 http://maven.apache.org/xsd/maven-4.0.0.xsd">
    <modelVersion>4.0.0</modelVersion>
    <parent>
        <groupId>org.springframework.boot</groupId>
        <artifactId>spring-boot-starter-parent</artifactId>
        <version>2.1.3.RELEASE</version>
        <relativePath/> <!-- lookup parent from repository -->
    </parent>
    <groupId>com.dalaoyang</groupId>
    <artifactId>springboot2_prometheus</artifactId>
    <version>0.0.1-SNAPSHOT</version>
    <name>springboot2_prometheus</name>
    <description>springboot2_prometheus</description>

    <properties>
        <java.version>1.8</java.version>
    </properties>

    <dependencies>
        <dependency>
            <groupId>org.springframework.boot</groupId>
            <artifactId>spring-boot-starter-actuator</artifactId>
        </dependency>
        <dependency>
            <groupId>org.springframework.boot</groupId>
            <artifactId>spring-boot-starter-web</artifactId>
        </dependency>
        <dependency>
            <groupId>org.springframework.boot</groupId>
            <artifactId>spring-boot-starter-test</artifactId>
            <scope>test</scope>
        </dependency>
        <dependency>
            <groupId>io.micrometer</groupId>
            <artifactId>micrometer-registry-prometheus</artifactId>
            <version>1.1.3</version>
        </dependency>
    </dependencies>


    <build>
        <plugins>
            <plugin>
                <groupId>org.springframework.boot</groupId>
                <artifactId>spring-boot-maven-plugin</artifactId>
            </plugin>
        </plugins>
    </build>
</project>
这块代码还是让你们JAVA开发的来处理吧;
1、配置文件
对配置文件中做一些变更,另外也需要输出management.metrics.tags.application,applicationName应用名这个很重要,因为POD IP会变所以最好用应用名来区分监控视图,配置如下:
spring.application.name=springboot_prometheus
management.endpoints.web.exposure.include=*
management.metrics.tags.application=${spring.application.name}
2、代码级添加application应用名
修改启动类:
@SpringBootApplication
public class Springboot2PrometheusApplication {

    public static void main(String[] args) {
        SpringApplication.run(Springboot2PrometheusApplication.class, args);
    }
    @Bean
    MeterRegistryCustomizer<MeterRegistry> configurer(
            @Value("${spring.application.name}") String applicationName) {
        return (registry) -> registry.config().commonTags("application", applicationName);
    }
}
SpringBoot项目代码变更到这里就完成了,访问curl http://10.220.70.25:8000/actuator/prometheus 如图所示: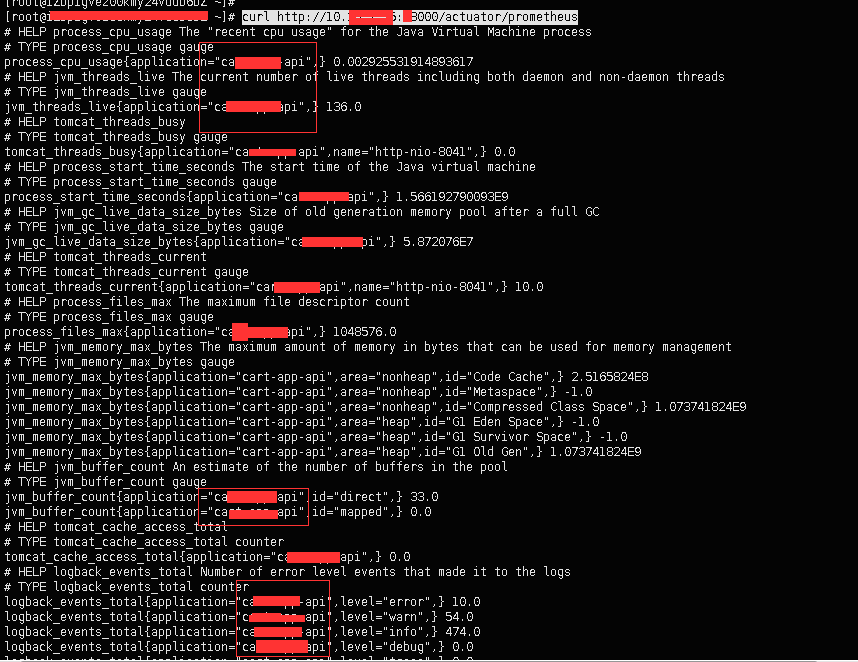
红色位置就是应用名称后面就是体现关联到Grafana去查看,而不需要去看POD IP之类的。
上面这些JAVA代码还是交给你们的JAVA开发来处理,告诉开发就是能输出上图这样的数据就可以的;而且还有个重点需要统一所有Springboot上的应用,访问这个/actuator/prometheus URI地址的端口要统一固定起来,比如8000或多少来着,这样下面写服务发现规则比较好定义
3、Prometheus配置
主要配置Prometheus的服务发现规则,如何去识别springboot监控数据,在prometheus配置监控SpringBoot应用,以下图示是配置规则,红框是关键的,一个是正则匹配pod名里面名称,我这边POD都含有prod,如下图一,如下图二的另外一个红框是替换容器端口为8000,就是你们上面Springboot设置的端口,定义什么端口就设置什么端口
图一
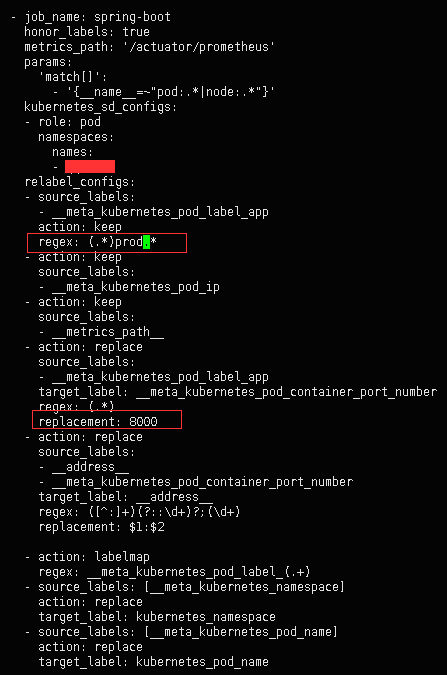
图二
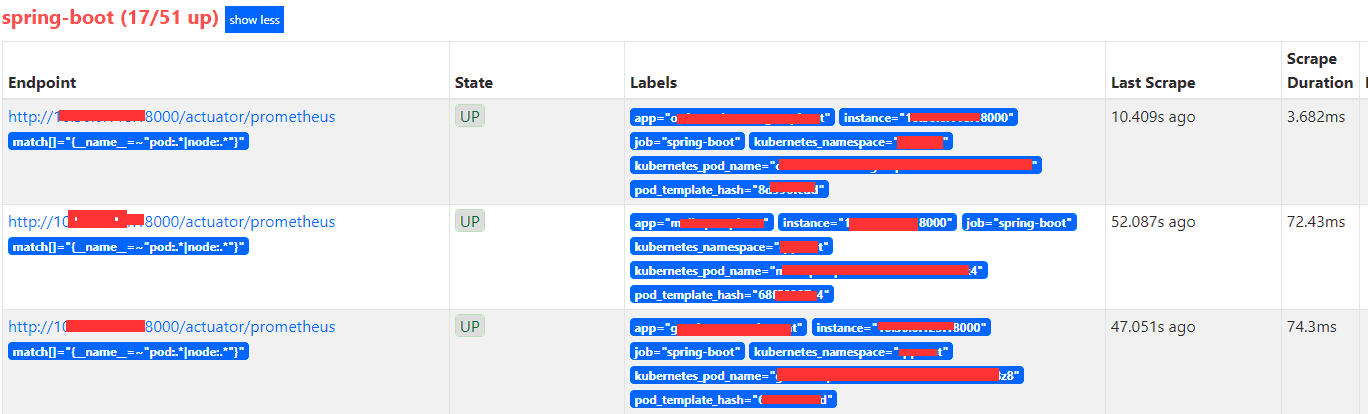
然后reload 下Prometheus配置,使其立即生效,打开prometheues页面点击---Status---Targets看如下图所示:
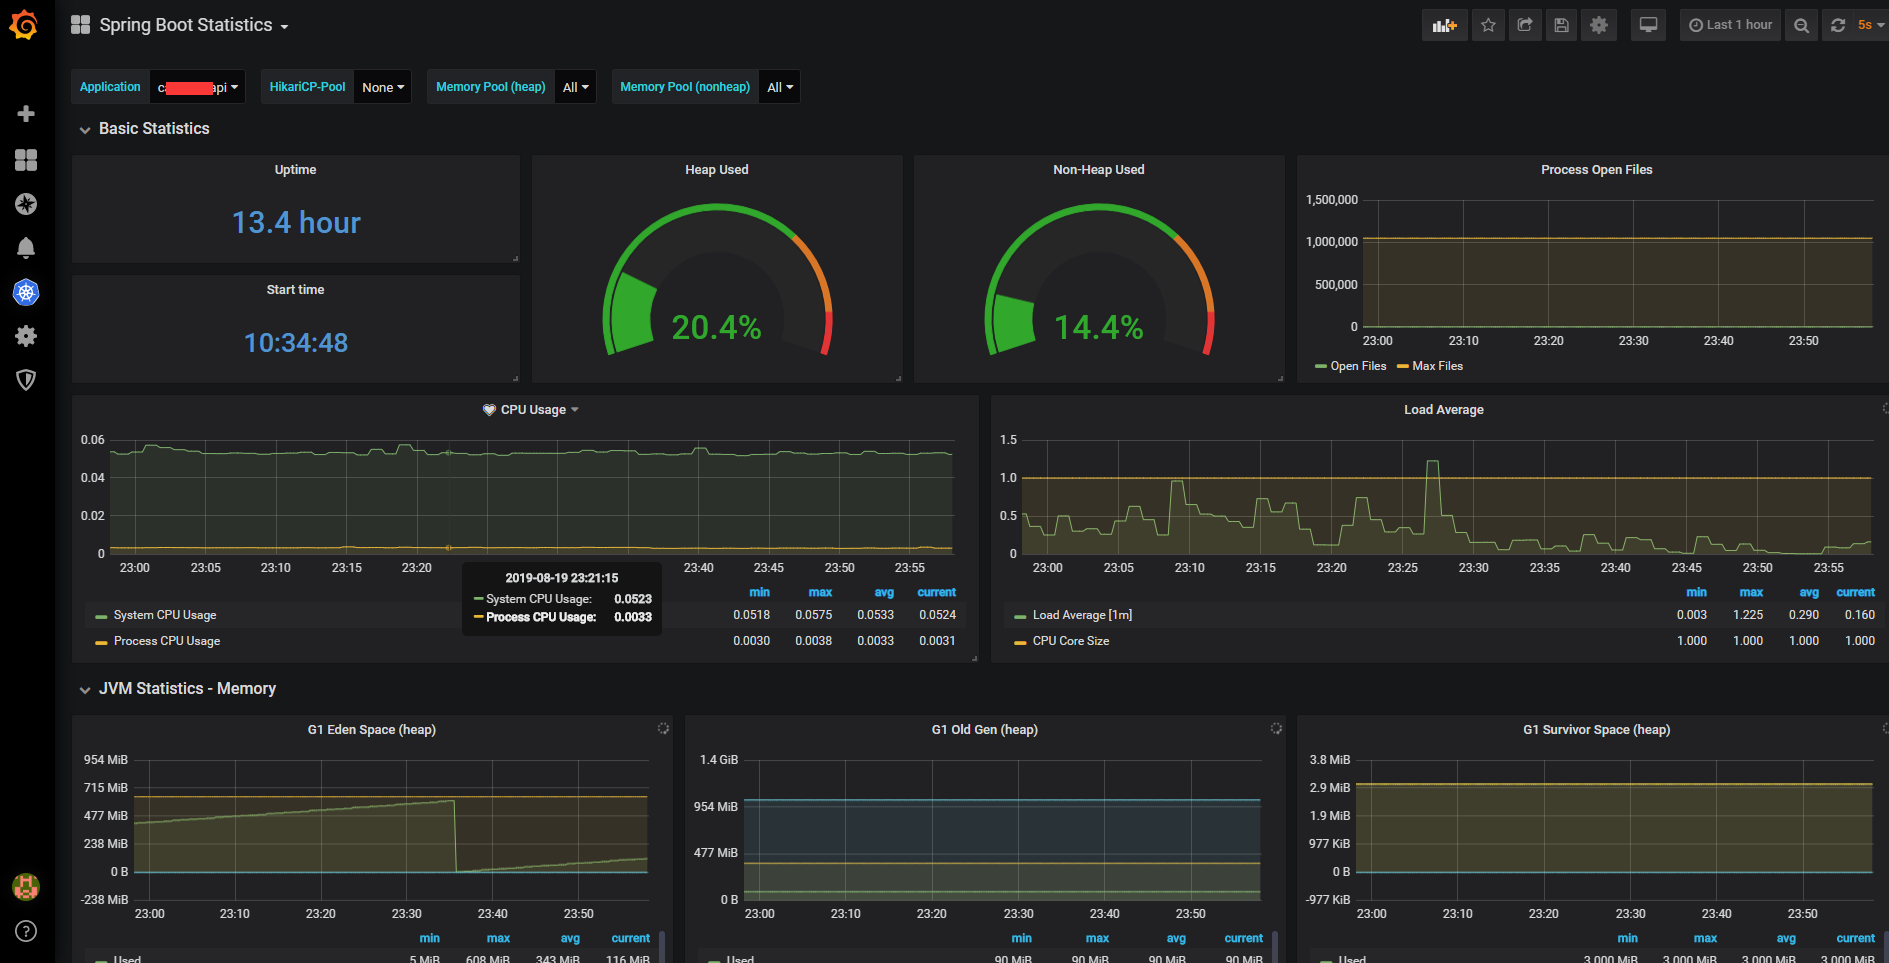
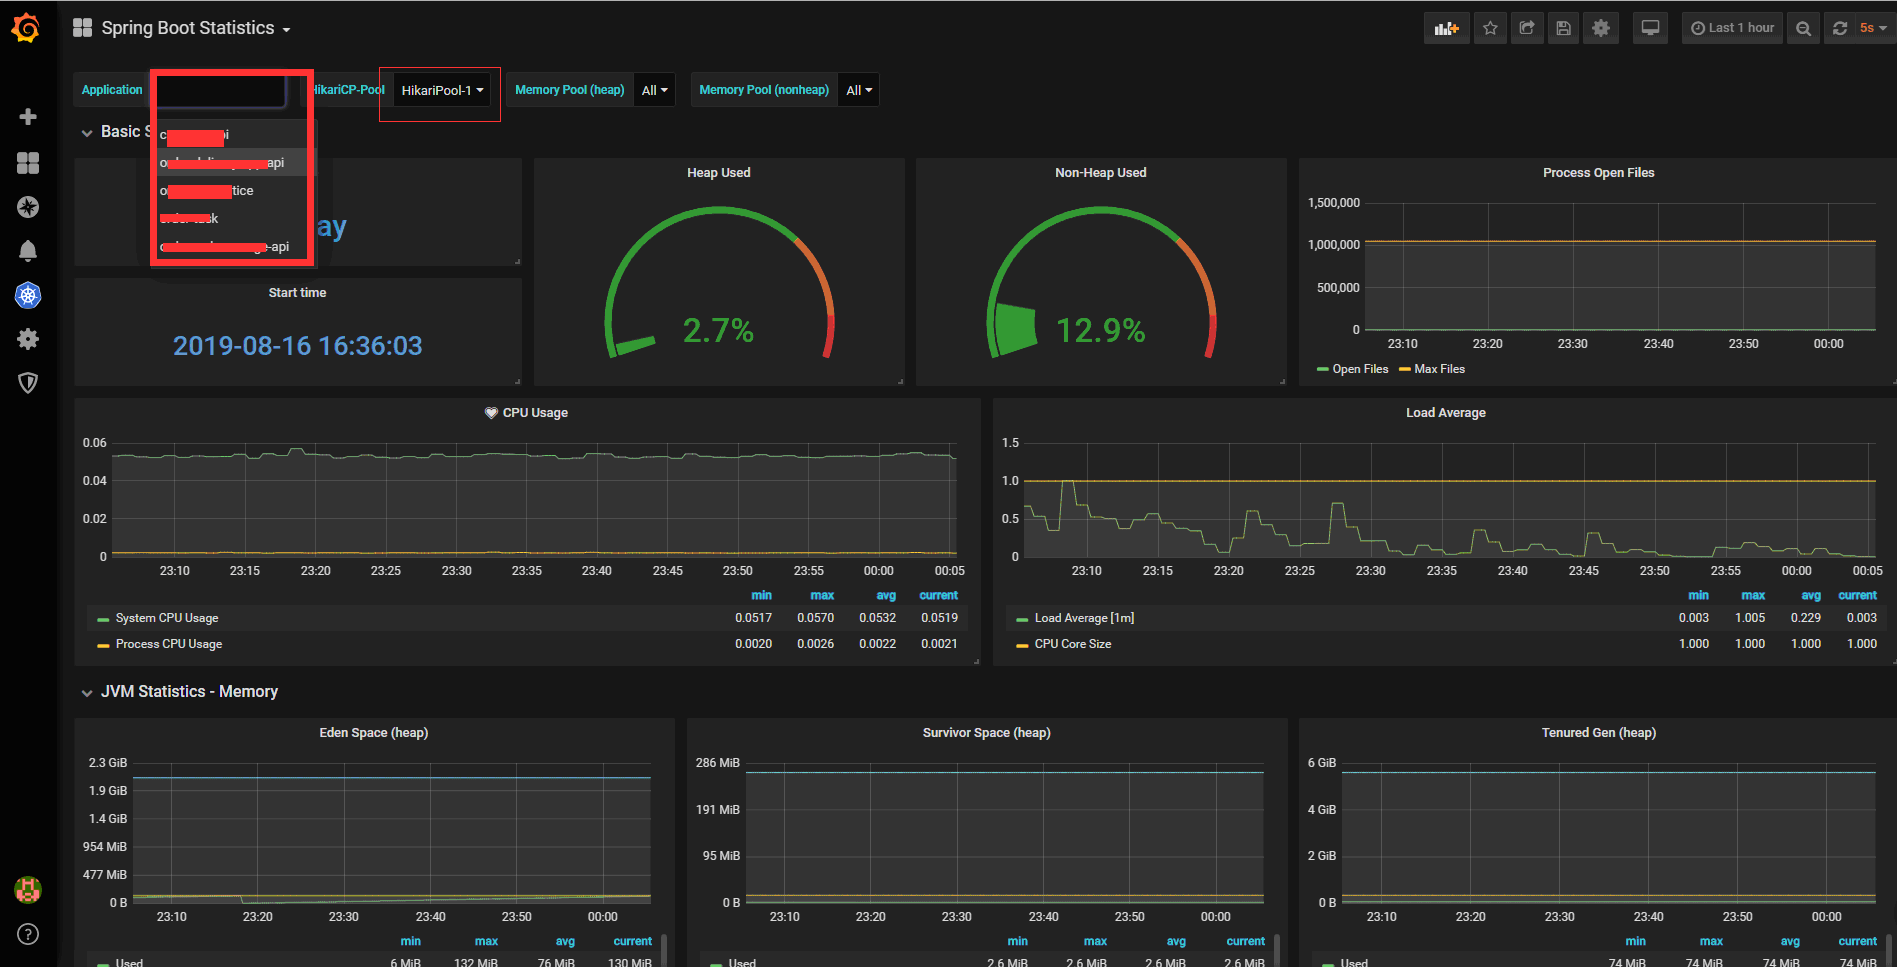
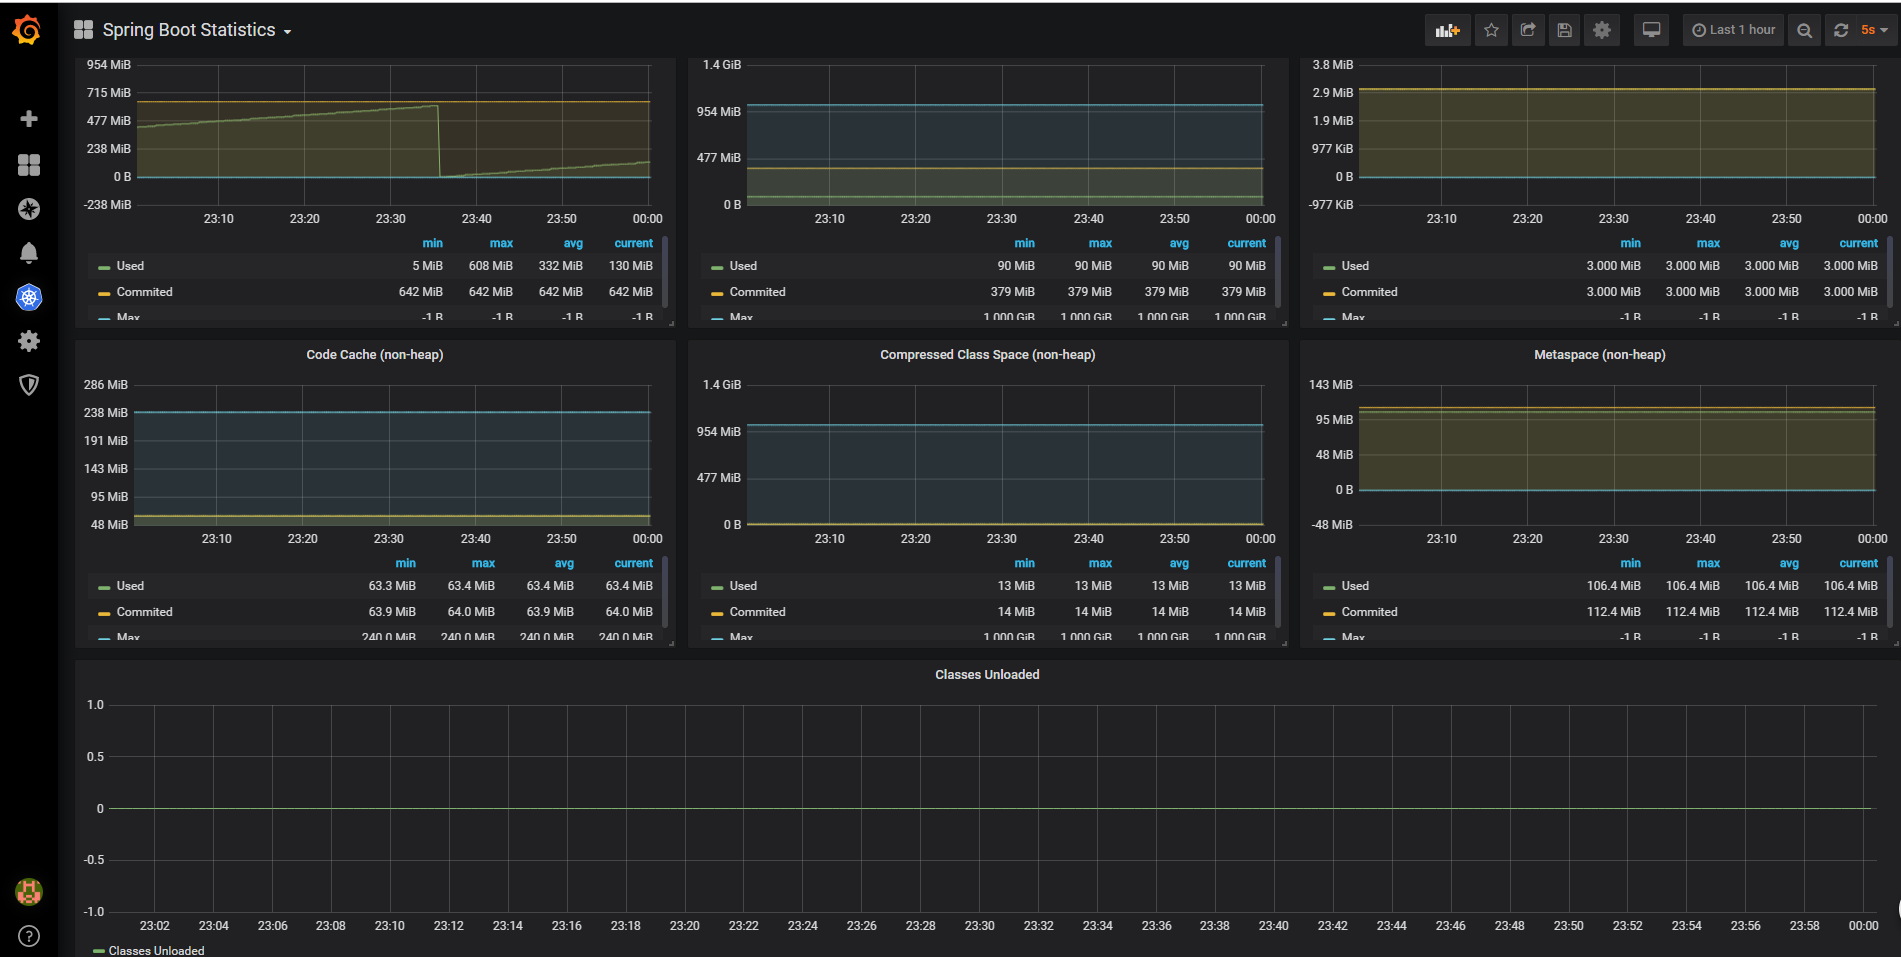
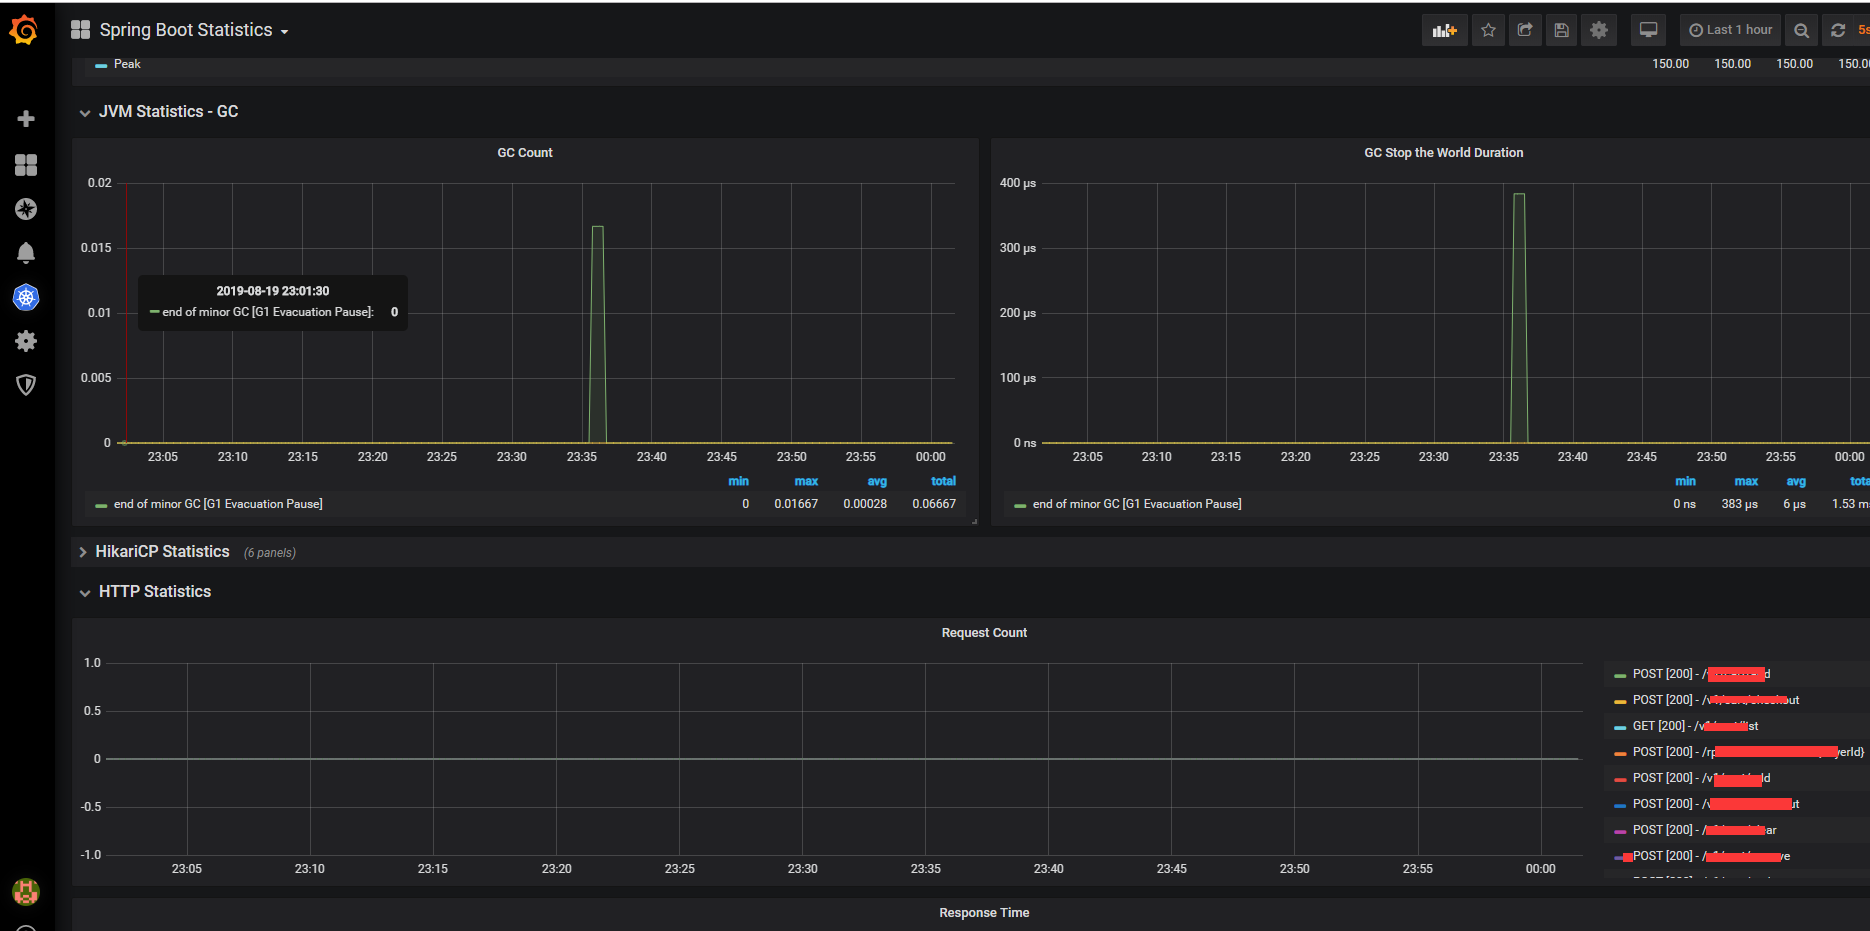
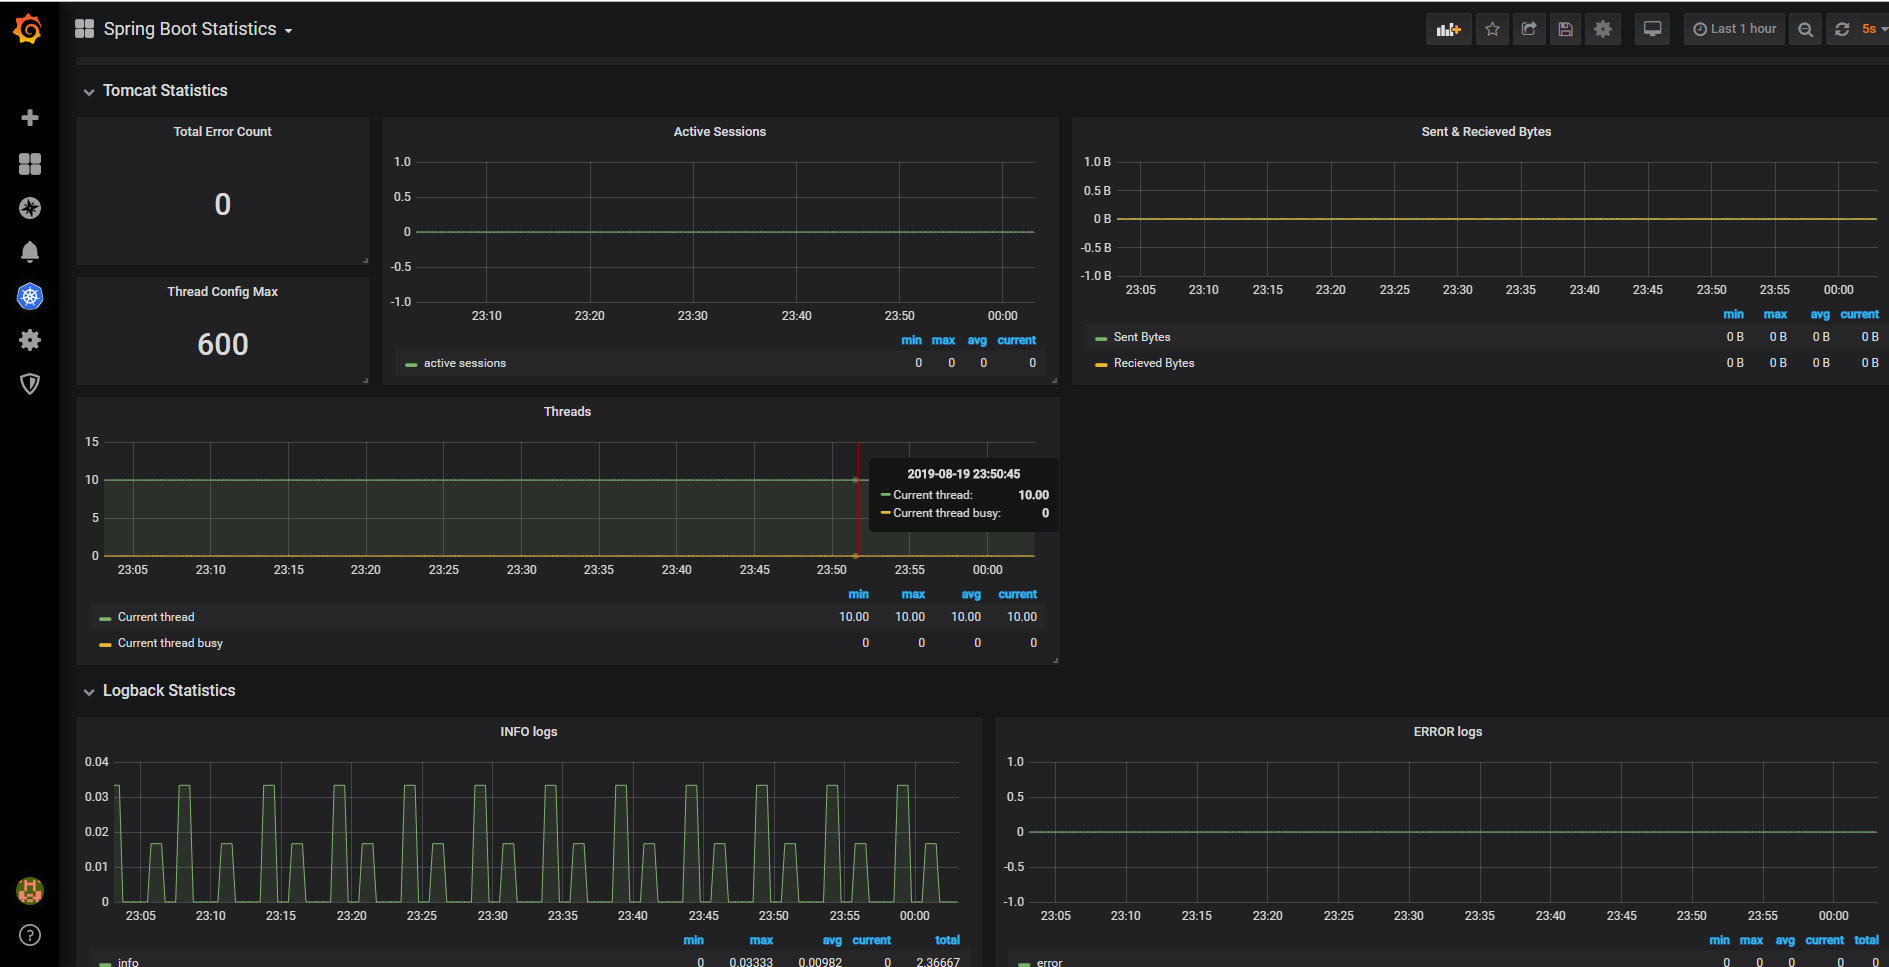
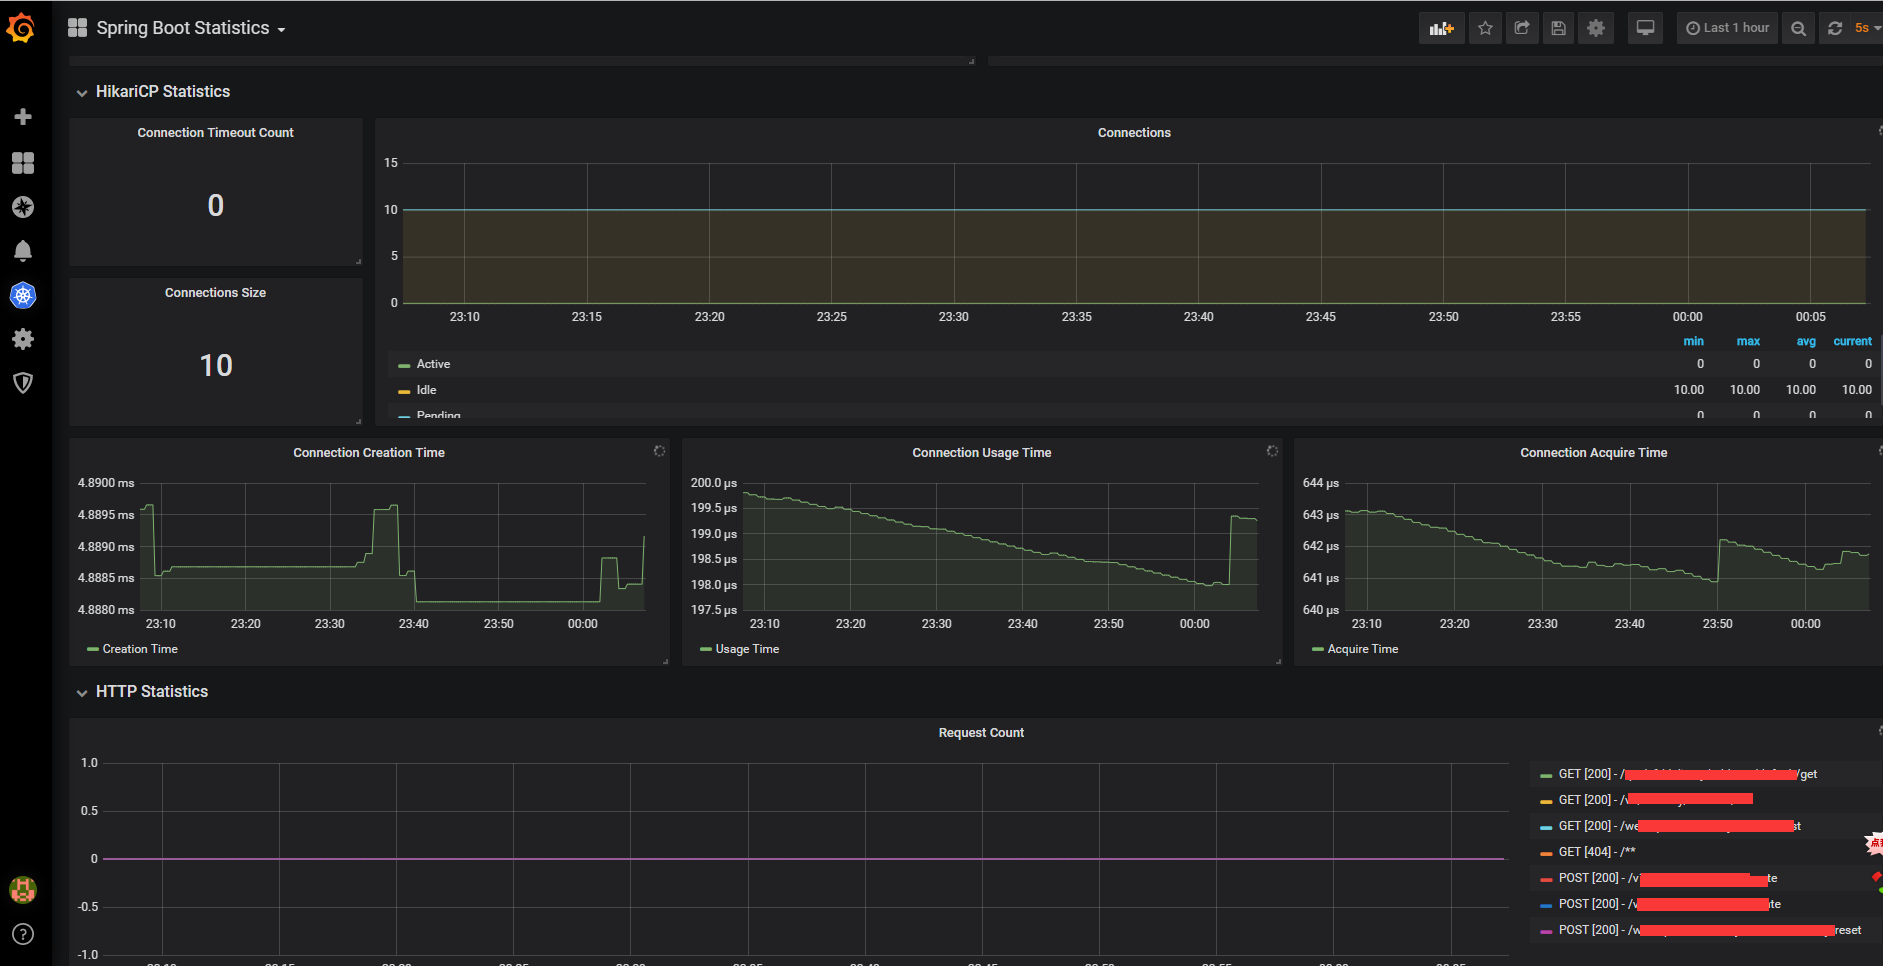
4、Grafana监控视图
下面在Grafana页面看Doshboard,下载模板Spring Boot Statistics-1566356176924 ,然后解压导入Spring Boot Statistics-1566356176924.json,以下图片是Grafana的Doshboard效果图


最新评论